I only trader part time. This blog finally becoming reference forex for me, may even you. It also become field copy paste any met in website other people. Do not be shy do not shy can contact I to trade mind. Any even come we joint with what which good..
Listen to Quran

Sunday, November 11, 2007

Indicator Mudah

Macam-macam indicator yg boleh digunakan. Yang paling mudah ikut ajer trend, cuma jangan ikut trend time frame 5 menet. Time masa yg sesuai ialah time 1 jam atau 30 menet. Nak mudah guna ajer MetaTrader. Set masa 1jam atau 30menet. Contoh indicator yg boleh diambil percuma dari internet. Pada indicator inilah signal buy atau sell boleh diramal. Pasti time masa yg sesuai utk indi tersebut sebab indicator mempunyai calculator masing2.
Ambo guno belako yg comel dan ringkas tidak memeningkan kepala. Semua indi menggunakan metatrader tapi semua urus niaga menggunakan marketiva.
Ado juga website yg memberi cadangan signal contoh http://www.zifx.com/daily.php Acu try test tengok kalu berhasil. Adalah sangat baik indi ini ditest terlebih dahulu menggunakan virtual dalu baru digunakan utk live trading.

Tip

  • sya trade guna fibo bila nak tau trend akan pergi jauh ke tidak. Fibo kadang2 tak menjadi untuk trade kecik2
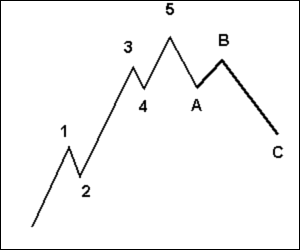
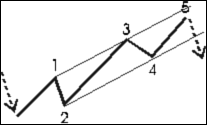
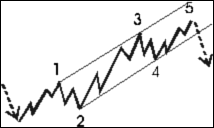
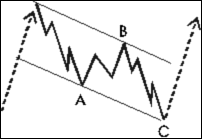
  • semua tf. untuk mengetahui pergerakan dia. gunakan TF 30/1/4 jam. jual beli Tf 15/5 minit. saya gunakan teknik 1 2 3 dan corak CS
  • RSI 50 ( mesti ), macd guna yg standard sudah memedai utk TF1 jam, period : 14 adalah yg terbaik, utk TF4 jam period 20 antara yg sesuai, TF daily lagi besar period dia... <--- ini asas ( period bermaksud nilai hari )
  • sya trade guna fibo bila nak tau trend akan pergi jauh ke tidak. Fibo kadang2 tak menjadi untuk trade kecik2
  • bacaan utk trend, bacaan utk kenalpasti overbough dan oversold area cth stoch, william%r, bacaan utk crossing trend cth ema, adx, etc , bacaan utk support dan ressistance level, pivot atau fibo , dan ada lagi...
  • dlm indicator mesti ada bacaan trend, sperti berikut, 1. Trend indicators
    Trend is a term used to describe the persistence of price movement in one direction over time. Trends move in three directions: up, down and sideways. Trend indicators smooth variable price data to create a composite of market direction. (Example: Moving Averages, Trend lines)
  • Support/resistance indicators
    Support and resistance describes the price levels where markets repeatedly rise or fall and then reverse. This phenomenon is attributed to basic supply and demand. (Example: Trend Lines)
  • Momentum indicators
    Momentum is a general term used to describe the speed at which prices move over a given time period. Momentum indicators determine the strength or weakness of a trend as it progresses over time. Momentum is highest at the beginning of a trend and lowest at trend turning points. Any divergence of directions in price and momentum is a warning of weakness; if price extremes occur with weak momentum, it signals an end of movement in that direction. If momentum is trending strongly and prices are flat, it signals a potential change in price direction. (Example: Stochastic, MACD, RSI)

Minggu Pengalaman Pengajaran

Hari 6 Nov 2007 merupakan hari pertama saya melakukan trading secara live menggunakan wang sendiri. Wang deposit menggunakan kaedah TT maybank secara offline. Tapi kadar yg dikenakan untuk sebarang transaksi ialah RM27 berbanding kaedah maybank2u online hanya RM10. Manakala pihak bank US pula mengenakan cas sebanyak USD20. Jadi sediakan wang secukupnya untk bayaran perkhidmatan ini. Tolak cas semua itulah total yg masuk ke live fund marketiva.

Pada pukul 3 petang saya memulakan dengan pair GU tapi akhirnya terjebak dalam pair UCAD kerana tertarik dengan komen saudara Ching73 dalam chat. Terima kasih Ching73 kerana cadangan itu telah menyebabkan saya untung sebanyak 140% sehingga pukul 9 malam. Sungguh mudah meneka UCAD pada masa itu kerana nilai USD menurun dgn kadar yg serata tanpa sideways yg menakutkan.

Satu kesilapan yg mudah yang tidak sepatutnya dibuat pada hari kedua trading kerana tidak menggunakan SL. Kealapaan ini menyebabkan kerugian USD90 hanya dalam masa 2jam30minit. Balik-balik minum air bersama rakan tengok2 dah rugi 50pip. Kesilapan yg paling bodoh.

Sikap tamak mula menyelubungi diri tanpa disedari. Saya kadang-kadang menggunakan sehingga 90% drp modal yang ada. Ini menyebabkan margin call berlaku apabila tekaan tersilap. Ketika inilah zaman kejatuhan mula berlaku. Saya telah dpt MC sehingga 5 kali dari hari Isnin hingga Jumaat.

Hari ketiga trading yang dilakukan saya banyak untung dari rugi. Kerugian berlaku disebabkan oleh sideways. Keadaan yg menakutkan kerana nampak macam nak u-turn balik tapi sebenarnya ia ialah sideways sahaja. Walaupun rugi tak banyak tapi nilainya banyak.

Hari Jumaat merupakan hari dimana harga minyak melambung tinggi ditambah lagi dengan harga emas telah mencapai puncaknya. Semua trend menjadi u-turn secara mengejut, dan pergerakkannya sungguh cepat. Tokleh nok mikir bakpo. Jadi duk tengok sajo rugi koho naik, nok lepas takut dio side way. Rupo2 dio ubah trend. Mapus 20USD. Tamboh lagi guna teknik minachi parok sungguh rugi maso niss. Tinggal baki USD70 jas untuk minggu depan.

Minggu depe nok cari USD30 utk start balik teknik 100 step. Teknik ini sebenarnya betul, tapi ambo pulok dok langar syarat. (20pip sehari dalam tangan, "kacang jas")

Tip

  • Jangan post masa news serentak, sebab masa itu terlalu sibuk menyebabkan flatpom marketiva macam 'hang' atau jadi gila, nok post, post awal spt 1 hinga 2 menet awal. Lagi mudah kalu guno pending oder.
  • SL dan TP boleh diubah2 mengikut kesesuaian.
  • Jangan layan sideway ( dia gerepok jas) yg penting trend kita betul
  • Tengok graf 15 minit tapi graf 1jam untuk pengesahan. Break out low and high ada dua, 1. high dan low terkini. 2. high dan low harian yg sedia ada
    Sila guna pivot, resitsance dan support level harian, atau guna indi2x yg bagi signal sup & res base one Time Frame, Cth TF 15 minit dia nya jarak low dan high agak kecik, TF 1 jam, jarak dia lagi besar, terpulang
    utk mendapatkan signal awal TF15 minit, untuk confirmation TF1 jam...
  • Apabila satu-satu pergerakkan terlaju lari dari trend, dia akan balik ke sarang semula contoh : selepas news. naik 50pip dlm masa 15 saat dia u-turn balik 50pip semula. jadi kita makan dua dua. naik makan turun makan. jadi jumlah 100pip
  • nak play save...kalaarah lum jelas...elok layan buy stop dan sell stop...kalau trend dia kuat...sure dia akan langar salah satu tersebut
  • Bagi peminat UCAD, boleh monitor UCAD, AUD CAD <--- signal kekuatan CAD boleh kita bandingkan dgn au cad sini... kalau dia laju junam...ucad will follow...if hangging, ucad will hangging also. pantang ucad.. jangan short lepas kul 12.. biar je dia floting.. better jngan trade.. buat tak tahu jer
    kalau awal siang2x hari boleh sell , kalau dah malam2x cam ni...dia dah buat retracement atas bawah atas bawah...yoyo je lebih
  • Sekalo eu ngan gu akan jatuh pd sesi tokyo...masuk je sesi london eu ngan gu panjat balik mcm selalu ke atas..
    6.00 tokyo..15.00 london..21.00 NY
  • minyak naik, us lagi lemah...
  • Utung rapat jit: kne monitor.. sape yang nk max TP leh tgk point high smlm .. kalau break leh edjas atas lg.. bagi yg play safe leh letak je kt mane2 bawah smlm nye high..
  • utk TF1 jam, period : 14 adalah yg terbaik, utk TF4 jam period 20 antara yg sesuai, TF daily lagi besar period dia... <--- ini asas ( period bermaksud nilai hari )


Monday, November 5, 2007

TIPS NEWS

Berikut 10 Peringkat News yang perlu diberi perhatian :
1. NonFarm_Payroll USA (100 – 200 pips).
Setiap JUMAAT Minggu Pertama tiap bulan, NEWS ini selalu Muncul....sebulan sekali, jam 19.30 WIB
2. Trade Balance USA (70 – 120 pips).
3. Interest Rate Statements (100 pips).
4. Durable Good (50 – 100 pips).
5. Producer Price Index (50 – 60 pips)
6. PPI excl. Food and Energy (50 – 60 pips)
7. Consumer Price Index (50 – 60 pips).
8. CPI excl. Food and Energy (50 – 60 pips).
9. Trichet, Bernanke, & Fukui Speaks (30 – 100 pips).
10. Unemployment Rate (30 – 50 pips).

Apa lagi, sila pasang perangkap.....

Sunday, November 4, 2007

Halal ke Haram

Mari lihat video ringkas oleh Utz Zaharuddin

Economic Indicators

A comprehensive glossary of economic indicators from the relevant markets. While these indicators are generally applicable economic terms, some of them are specific for the country of their release.

Auto Sales
Balance of Payments
Balance of Trade (Merchandise Trade Balance)
Beige Book Fed Survey
Business Inventories and Sales
Capital Account (now known as Financial Account)
CBI Surveys
Construction Spending
Consumer Price Index (CPI)
Current Account
Durable Goods Orders
Employment Cost Index (ECI)
Employment Report
Factory Orders and Manufacturing Inventories
Gross Domestic Product (GDP)
HICP (Harmonized Index of Consumer Prices)
Housing Starts/Building Permits
IFO
Implicit Deflator
Index of Leading Economic Indicators (LEI)
The Institute of Supply Management (ISM)
L
M1
M2
M3
New Home Sales
Personal Income and Personal Consumption Expenditures (PCE)
Producer Price Index (PPI)
Productivity
Purchasing Managers' Index (PMI)
Retail Sales
Tankan Survey
ZEW Indicator

Elliott Wave Theory

Ralph Nelson Elliott developed the Elliott Wave Theory in the late 1920s by discovering that stock markets, thought to behave in a somewhat chaotic manner, in fact, did not. They traded in repetitive cycles, which he discovered were the emotions of investors as a cause of outside influences, or predominant psychology of the masses at the time. Elliott stated that the upward and downward swings of the mass psychology always showed up in the same repetitive patterns, which were then divided into patterns he termed "waves".

The theory is somewhat based upon the Dow Theory inasmuch as the price movements move in waves. It was understood by the technicians at the time that because of the fractal nature of the markets, Elliott was able to break down and analyze the markets in much greater detail.
Elliott was able to spot unique characteristics of wave patterns and make detailed market predictions based on the patterns he identified. Fractals are mathematical structures, which on an ever-smaller scale infinitely repeat themselves. The patterns that Elliott discovered are built in the same way. An impulsive wave, which goes with the main trend, always shows five waves in its pattern. On a smaller scale, within each of the impulsive waves of the before-mentioned impulse, five waves can again be found. In this smaller pattern, the same pattern repeats itself ad infinitum. These ever-smaller patterns are labeled as different wave degrees in the Elliott Wave Principle. Only much later were fractals recognized by scientists.
In the financial markets we know that "every action creates an equal and opposite reaction" as a price movement up or down must be followed by a contrary movement. Price action is divided into trends and corrections or sideways movements. Trends show the main direction of prices while corrections move against the trend. Elliott labeled these "impulsive waves" and "corrective waves".
The interpretation of the Elliott Wave Theory is as follows:

  • Every action is followed by a reaction.
  • There are five waves in the direction of the main trend followed by three corrective waves (a "5-3" move).
  • A 5-3 move completes a cycle.
  • This 5-3 move then becomes two subdivisions of the next higher 5-3 wave.
  • The underlying 5-3 pattern remains constant, though the time span of each may vary.
Let's have a look at the following chart made up of eight waves (five up and three down) which are labeled 1, 2, 3, 4, 5, a, b and c.


You can see that the three waves in the direction of the trend are impulses, so these waves also have five waves. The waves against the trend are corrections and are composed of three waves.


In the 70s, this wave principle gained popularity through the work of Frost and Prechter. They published a legendary book on the Elliott Wave, entitled "The Elliott Wave Principle – The Key to Stock Market Profits". In this book, the authors predicted the bull market of the 1970s, and Robert Prechter called the crash of 1987.


The corrective wave formation normally has three, in some cases five or more, distinct price movements, two in the direction of the main correction (A and C) and one against it (B). Waves 2 and 4 in the above picture are corrections. These waves have the following structure:


Note that the waves A and C go in the direction of the shorter-term trend, and therefore are impulsive and composed of five waves, which is shown in the picture above.

An impulse-wave formation followed by a corrective wave, form an Elliott wave degree, consisting of trends and countertrends. Although the patterns pictured above are bullish, the same applies for bear markets, where the main trend is down.

The Elliott Wave Theory has assigned a series of categories to the waves in order of the largest to the smallest. They are:
  • Grand Supercycle
  • Supercycle
  • Cycle
  • Primary
  • Intermediate
  • Minor
  • Minute
  • Minuette
  • Sub-Minuette
To use the theory in everyday trading, the trader determines the main wave, or supercycle, goes long and then sells or shorts the position as the pattern runs out of steam and a reversal is eminent.

Strategi 100 Langkah

Strategi ini menggunakan konsep 20pip melalui Marketiva. Maksudnya setiap post kita perlu mencari keuntungan sebanyak 20pip. Tapi jika nasib kita baik, contohnya kita mendapat 40pip maka kita terus 2 langkah ke depan. Manakala jika kita rugi 40pip maknanya kita terpaksa undur 2 langkah ke belakang. Petuanya 20pip satu hari.... dah dapat tunggu esok pula cari 20pip lagi... jangan tamak nak cepat kaya, Emosi penting dalam forex nih. Contoh jalan kira.... iskkk malas la nak taip... lu pikir ler sendiri.
Harus diingatkan anda dilarang sama sekali mengambil keuntungan sebelum mencapai target 100 walau macamana sekali pun. Jika mengambil untung pun tolong tinggalkan modal sebanyak $12,000 untuk trading seterusnya.

Hari

Modal

Margin

Quantity

Profit

1

$100

$25

$2,500

$5

2

$105

$26

$2,625

$5

3

$110

$28

$2,756

$6

4

$116

$29

$2,894

$6

5

$122

$30

$3,039

$6

6

$128

$32

$3,191

$6

7

$134

$34

$3,350

$7

8

$141

$35

$3,518

$7

9

$148

$37

$3,694

$7

10

$155

$39

$3,878

$8

11

$163

$41

$4,072

$8

12

$171

$43

$4,276

$9

13

$180

$45

$4,490

$9

14

$189

$47

$4,714

$9

15

$198

$49

$4,950

$10

16

$208

$52

$5,197

$10

17

$218

$55

$5,457

$11

18

$229

$57

$5,730

$11

19

$241

$60

$6,017

$12

20

$253

$63

$6,317

$13

21

$265

$66

$6,633

$13

22

$279

$70

$6,965

$14

23

$293

$73

$7,313

$15

24

$307

$77

$7,679

$15

25

$323

$81

$8,063

$16

26

$339

$85

$8,466

$17

27

$356

$89

$8,889

$18

28

$373

$93

$9,334

$19

29

$392

$98

$9,800

$20

30

$412

$103

$10,290

$21

31

$432

$108

$10,805

$22

32

$454

$113

$11,345

$23

33

$476

$119

$11,912

$24

34

$500

$125

$12,508

$25

35

$525

$131

$13,133

$26

36

$552

$138

$13,790

$28

37

$579

$145

$14,480

$29

38

$608

$152

$15,204

$30

39

$639

$160

$15,964

$32

40

$670

$168

$16,762

$34

41

$704

$176

$17,600

$35

42

$739

$185

$18,480

$37

43

$776

$194

$19,404

$39

44

$815

$204

$20,374

$41

45

$856

$214

$21,393

$43

46

$899

$225

$22,463

$45

47

$943

$236

$23,586

$47

48

$991

$248

$24,765

$50

49

$1,040

$260

$26,003

$52

50

$1,092

$273

$27,303

$55

51

$1,147

$287

$28,668

$57

52

$1,204

$301

$30,102

$60

53

$1,264

$316

$31,607

$63

54

$1,327

$332

$33,187

$66

55

$1,394

$348

$34,847

$70

56

$1,464

$366

$36,589

$73

57

$1,537

$384

$38,419

$77

58

$1,614

$403

$40,339

$81

59

$1,694

$424

$42,356

$85

60

$1,779

$445

$44,474

$89

61

$1,868

$467

$46,698

$93

62

$1,961

$490

$49,033

$98

63

$2,059

$515

$51,485

$103

64

$2,162

$541

$54,059

$108

65

$2,270

$568

$56,762

$114

66

$2,384

$596

$59,600

$119

67

$2,503

$626

$62,580

$125

68

$2,628

$657

$65,709

$131

69

$2,760

$690

$68,994

$138

70

$2,898

$724

$72,444

$145

71

$3,043

$761

$76,066

$152

72

$3,195

$799

$79,869

$160

73

$3,355

$839

$83,863

$168

74

$3,522

$881

$88,056

$176

75

$3,698

$925

$92,459

$185

76

$3,883

$971

$97,082

$194

77

$4,077

$1,019

$101,936

$204

78

$4,281

$1,070

$107,033

$214

79

$4,495

$1,124

$112,384

$225

80

$4,720

$1,180

$118,003

$236

81

$4,956

$1,239

$123,904

$248

82

$5,204

$1,301

$130,099

$260

83

$5,464

$1,366

$136,604

$273

84

$5,737

$1,434

$143,434

$287

85

$6,024

$1,506

$150,606

$301

86

$6,325

$1,581

$158,136

$316

87

$6,642

$1,660

$166,043

$332

88

$6,974

$1,743

$174,345

$349

89

$7,322

$1,831

$183,062

$366

90

$7,689

$1,922

$192,215

$384

91

$8,073

$2,018

$201,826

$404

92

$8,477

$2,119

$211,917

$424

93

$8,901

$2,225

$222,513

$445

94

$9,346

$2,336

$233,639

$467

95

$9,813

$2,453

$245,321

$491

96

$10,303

$2,576

$257,587

$515

97

$10,819

$2,705

$270,466

$541

98

$11,360

$2,840

$283,989

$568

99

$11,928

$2,982

$298,189

$596

100

$12,524

$3,131

$313,098

$626