
Forex Programs
Forex Killer Software 3.3.2 was created for beginners as well as experienced traders. With the Forex Killer manual, detailed "Forex Learning Book" and "Crush course" beginners will learn everything they need to know about the forex market to start trading within the next hours! Forex Killer is successfully used by newbies with no Forex experience at all!
Download :
New Version! Forex Killer V.3.3.2 June 2008
ELWAVE Software has generated a lot of interest all over the world over the years, which has resulted in reviews in various well known and well respected magazines in many different countries. Below you will find most of these reviews and find out what others have to say about ELWAVE: Check out the review of ELWAVE 4.0 in the August issue of Stocks & Commodities
Download :
Elliot Wave V.7.1
MT Predictor Software help traders identify low risk/high return daily chart trades, evaluate their Risk/Reward outlook, determine position size and run a consistent trade management policy, our Isolation Approach™ to Elliott wave avoids the usual confusion of counts changing mid- trade and conflicting patterns and timeframes. The trader can focus on the Risk/Reward equation for long-term success.
Download :
MT Predictor V.5.0
GPS Software scans multiple currencies and time frames looking for price consolidation patterns. When a forming pattern is identified, traders using the PRS will be alerted. Completed patterns offer traders a look at where the price direction is most likely to head, thus offering a potential take profit region. The IBFX-PRS can be used to spot potentially strong trades, or to confirm the strength of current positions held.
Download :
IBX PRS
Trading Simulator improve your trading more than you may realize at first.
I suggest that you spend at least an hour in the simulator per day.
Download :
Trade Simulator 2.0
Best MT4 Indicators
Download
Best MT4 Expert Advisor
Download
Best MT4 Script
Download
Fibonacci Calculator
Download
Forex Global News
Download
Forex Market Hours Monitor
Download
Global Clock On Your Desktop
Download
Download Best Seller Forex Books
CandleStick Charting Techniques - Steve Nison (330 Pages)
Download
Beyond The CandleStick - Steve Nison (276 Pages)
Download
School of Pipsology - Babypips.com (309 Pages)
Download
Fibonacci Ratios with Pattern Recognition (184 Pages)
Download
1-2-3 Pattern, 1-2-3 System (24 Pages)
Download
Trading For A Living - Elder Alexander (312 Pages)
Download
Investment, Trading - Soros Unauthorized Biography (261 Pages)
Download
Trading In The Zone by Mark Douglas (143 Pages)
Download
Bird Watching In Lion Country by DrForex (236 Pages)
Download
Quantum Globe Trading Strategy (126 Pages)
Download
The Book of Technical Market Indicators (49 Pages)
Download
25 Rules of Millionaire Traders (5 Pages)
Download
Fibonacci and Elliot Wave (5 Pages)
Download
The Secret (146 Pages)
Download
Money Management (154 Pages)
Download
5 New Trend Line Method (96 Pages)
Download
MQL 4 Lessons for Indicators and EA Programming
Download
Trade Divergence System (63 Pages)
Download
Friday, June 27, 2008
Download Forex Tool
Saturday, June 21, 2008
Make Money With Forex Trading System
Time frame: 5 minutes
Trading time: From EU open until US close
Recommended Forex Pairs: USD/JPY, USD/CHF, GBP/USD, EUR/USD, USD/CAD, AUD/USD, EUR/JPY and Gold
Trend Follower© - Master the markets with correct timing and executing rules
Indicators and template are for MT4, Meta trader.
DOWNLOAD
MIRROR
This is not a "get rich quick" scheme. Real efforts are required to learn trading this system. As always try to demo or paper trade the system first before using real money. Trading the forex market has large potential rewards and as such also large potential risks. You must be aware of the risks and willing to accept them in order to place responsible, informed trading orders. It is strongly advised not to trade with money you can not afford to lose.
©Copyright 2007, ALL RIGHTS RESERVED
Notice: This publication is designed to provide valuable information. It is written with the understanding that the publisher or author is not engaged in rendering legal, accounting, or other professional service. If legal advice or other assistance is required, the service of a competent professional should be sought. No part of this publication may be reproduced, stored in a retrieval system or transmitted in any form or by any means, electronic, mechanical, photocopying, recording or otherwise without the prior written permission of the author.
Components of The System
First we are going to take the system apart and provide a little description of all the indicators.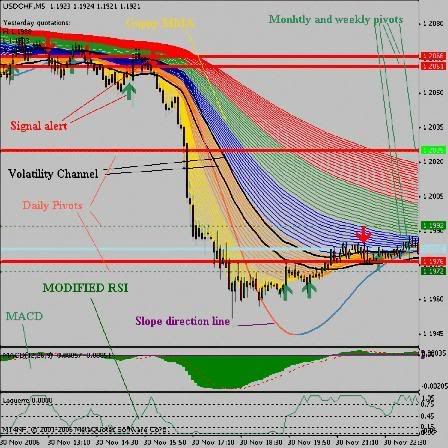
The indicators are:
a) Signal Arrows
b) MACD
c) Volatility Channel
d) Laguerre
e) Slope Direction line
f) Pivot Points
g) Guppy Multiple Moving Averages (GMMA)
Signal Arrows
The alert is produced by a cross of two Exponential Moving Averages. Faster EMA is 4 and slower EMA is 8.
MACD Histogram
The default settings are (our system uses 5,35,5) :
* Slow moving average - 26 days
* Fast moving average - 12 days
* Signal line - 9 day moving average of the difference between fast and slow.
* All moving averages are exponential.
The signals from the MACD indicator tend to lag price movements. The MACD Histogram attempts to address this problem by plotting the distance between MACD and its signal line. Because of this, the histogram signals trend changes well in advance of the normal MACD signal. It however should not be used alone, therefore we have other indicators to confirm our signal.
Volatility Channel
This is a technique that measures volatility. It consists of 34 EMA high and 34 EMA low. It is not really a part of the system, but I like to see it, especially if I look for confirmation on longer time frame.
Laguerre
This is an advanced form of RSI indicator. The Laguerre Transform provides a time warp such that the low-frequency components are delayed much more than the high-frequency components. Globally, latest bar data has more weight than previous bar data a bit like an exponential moving average.
Slope Direction Line
The name says is it all. Its a line that measures the slope of the trend and direction as well. The direction is shown as red for a downtrend and blue for an uptrend.
Pivot Points
Traders use pivot points to find intraday support/resistance levels. Pivot points are found by a simple calculation which involves the open, high, low and close for the previous day of any particular stock or index. It is said that when a price hovers below a pivot or pivot support/resistance and breaks up through it then its a buy signal (or vice versa for a sell signal). Or if the prices are above the pivot it is considered bullish and if they are below then bearish. The most common way to use pivot points are as reference points for entering trades if your other favorite indicators are also giving the same directional signal. Market Makers can use the pivot points to create a market by shifting the price around between levels to entice buyers or sellers of a stock into a trade. This can best be seen on low volume trading days as the prices fluctuate between the calculated points.
Many variations exist for calculating the pivot point and its related support and resistance levels. The Traditional Method:
* Pivot point = (H + L + C)/3
* First support = (2 * Pivot) – H
* First resistance = (2 * Pivot) – L
* Second support = Pivot – (H – L)
* Second resistance = Pivot + (H – L)
In our system we mainly use pivots for exits. You don't need to know these calculations as they are automatically calculated in the software, its more just for informational purposes.
Guppy Multiple Moving Averages GMMA
The Guppy MMA is a combination of moving averages and is optimized to allow for smoother and more accurate moving averages that are not easily spiked by sudden market movements.
The biggest fallacy of basic moving average crossover systems is that they can and will be very choppy when markets are not trending. At the same time when using basic crossovers systems the traders have little or no idea of underlying trend. Is the trend continuing or is it about to end. The Guppy MMA will answer all this questions and will give you the reason why you entered the trade so you can improve on your trading skills.
The importance of this indicator can not be emphasized enough! You must agree with what it is that it is telling you. The original guppy method was created by Darryl Guppy and is called the guppy. The original consists of 3,5,8,10,12 and 15 EMA for the short term moving averages (traders) and 30,35,40,45,50 and 60 EMA long term moving averages (investors).
The time frame is not important with this indicator, in the Trend Follower system we use it in 5 minute markets, but it can be used anywhere from 1m to monthly charts. It is just as accurate in any time frame. In our modified guppy we use 5 different colors for each different type of trader. When you are trading it is important that you know the underlying trend, hence you have to know what other traders are doing. Using the colors you are able to tell what other market participants are up to and as such make better trading decisions.
1. Yellow - short term traders (Mainly going for quick pips and not interested in holding positions)
2. Orange - short term traders (Those hold on the positions a little longer than the yellow)
3. Blue - mid term traders (Mainly swing traders, usually hold on the positions longer than previous 2)
4. Green - long term traders (Will hold on to their positions longer than mid and short term traders)
5. Red - long term traders or investors (They hold on to their position the longest)
The MMA reveals the relationship between short term traders and investors. Traders (yellow and orange) probe for weakness in the underlying trend and always lead the next trend or current trends. As they are going for quick profits, they are in and out of the market very quickly. Investors on the other hand are slow to move. However for a trend to succeed, the support of investors (red and green) is essential.
As a trend trader, you will be looking for situations where all the traders agree on the direction of the market (Yellow, Orange, Blue, Green & Red moving averages). If all the traders are in agreement, then that is the direction to trade. Any disagreement means you do not trade. By correct interpretation of the MMA, you will be able to identify the trend, possible trend exhaustion and also possible trend changes. Overall, you will be able to make better trading decisions.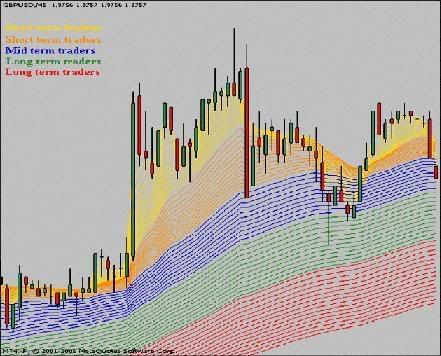
Breakouts
Though we avoid trading breakouts, the guppy MMA shows us exactly when this is happening. Once a breakout has occurred whereby the yellow lines cross the red lines but the green lines are still below the red, we would expect the yellow lines to retrace back. This is the point where we would be waiting to place our new positions in the direction of the new trend. Please note that you DO NOT place trades during a breakout but after the prices have retraced which is denoted by the green and red lines changing positions.
Long Breakout:
The red lines had been above the green lines then the yellow crossed the red lines and soon the price retraced to the other lines. The green are now above the reds and they show a long trend.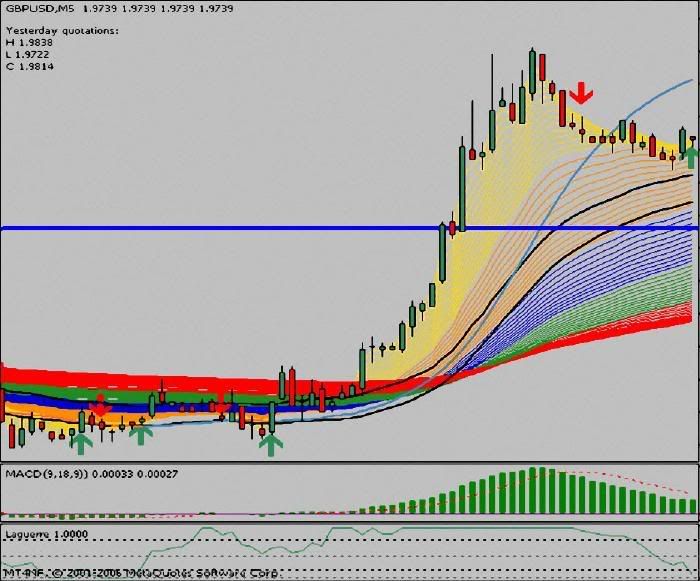
Short Breakout:
The red lines had been below the green lines. This was indicating a long trend. Then the yellow lines crossed the green and red lines. Once the green lines have been below the red lines we can say that we are in a short trend now and we can wait for signals.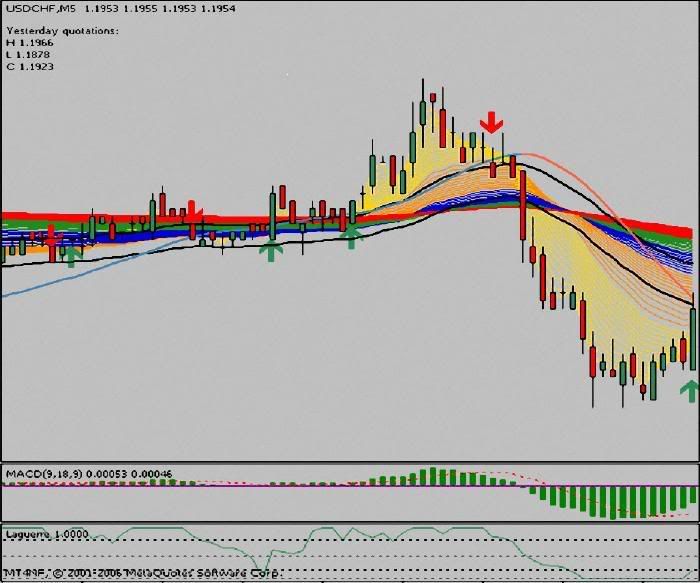
Remember the positions of GREEN lines and RED lines. For a trend to be considered long the green must be above the red lines, and for short the green lines must be below the red lines.
False Breakouts
False breakouts can be more easily identified with the Guppy MMA. This also is one of many benefits of this indicator. False breakouts can be financially and emotionally draining to a trader.
If the yellow or orange color lines cross the reds but the green lines still remain in their previous direction, then we are most likely facing a false breakout. For a trend change all lines especially the greens must change positions with the reds. You should especially be careful with volatile pairs such as GBP/USD.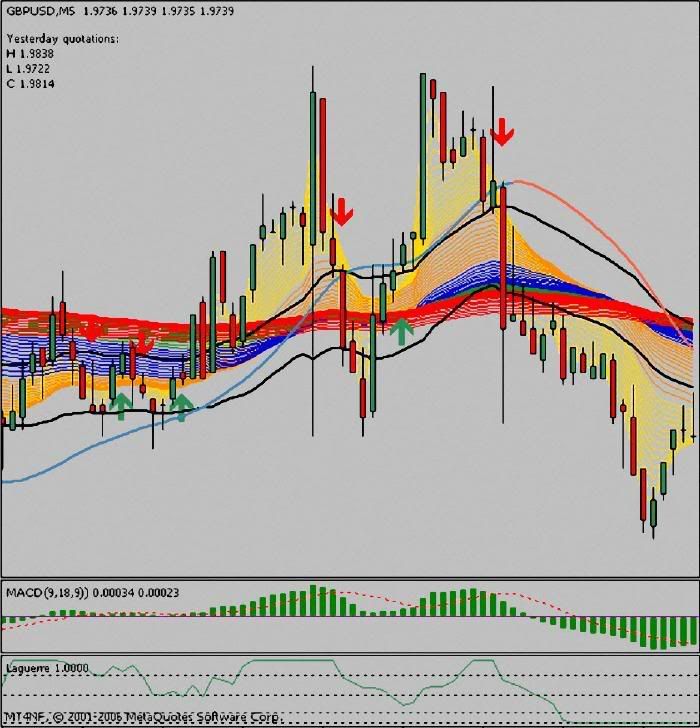
The Rules
Trend Follower - The Rules
All the criteria must be met at the bar with signal or one after! If everything is not met at the signal bar or one after, leave it alone! It might eventually go the right way, but in the long term it will give more false trades. Only take trades where at the signal bar or one after all these rules apply! We enter the next bar after the signal.
Long\Buy
ENTRY: First We wait for a long signal alert
GUPPY MMA: The green lines must be above the red lines! Green, Red and Yellow lines must agree and head north. All the lines must be going in the same direction!
LAGUERRE: Laguerre line must cross the 0.15 from below and head up
MACD: This is important! When you get the signal MACD must be above 0
STOP LOSS: 5 points (+spread!) below recent LOW
ALTERNATE STOP LOSS: 20 points on default pairs and 25 point on more volatile pairs such as the GBP pairs and crosses. Choose whatever SL method fits you best
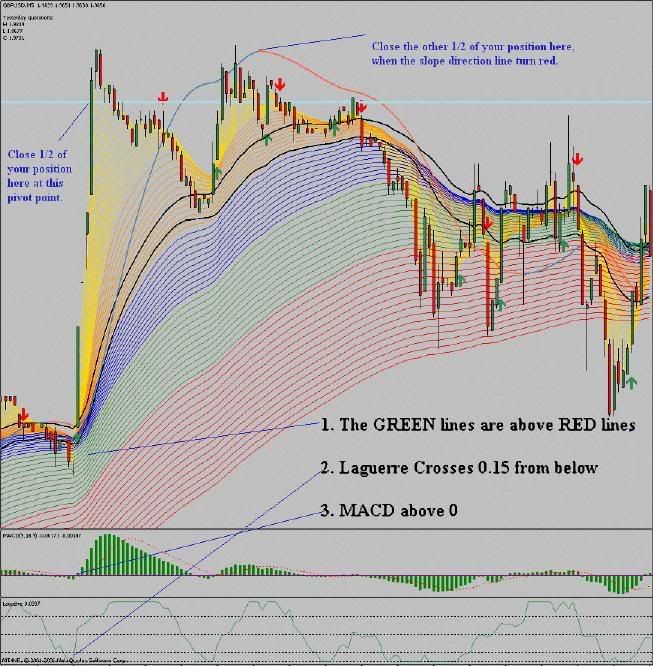
EXIT (combined): When you open a position you can then choose to close half of the position on the first pivot point and let the other half run till the slope direction line goes red
ALTERNATE EXIT: You can choose your own method and close positions at pivot points or when slope direction line goes red after a move, or when price (a new candle) opens on the other side of the volatility channel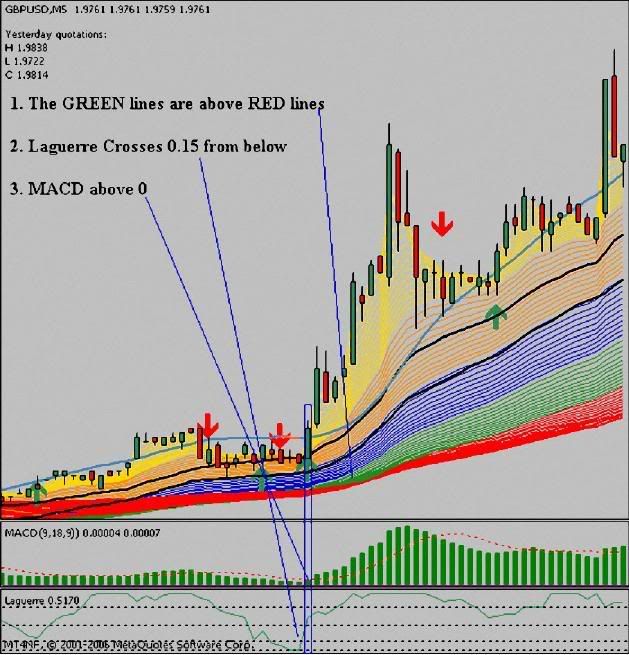
Short\Sell
ENTRY: First We wait for a short signal alert
GUPPY MMA: The green lines must be below the red lines! Green, Red and Yellow lines must agree and head south.All the lines must be going in the same direction!
LAGUERRE: Laguerre line must cross the 0.75 from above and head down
MACD: This is important! When you get the signal MACD must be below 0
STOP LOSS: 5 points (+spread!) above recent HIGH
ALTERNATE STOP LOSS: 20 points on default pairs and 25 point on more volatile pairs such as the GBP pairs and crosses. Choose whatever SL method fits you best
EXIT (combined): When you open a position you can then choose to close half of the position on the first pivot point and let the other half run till the slope direction line goes blue.
ALTERNATE EXIT: You can choose your own method and close positions at pivot points or when slope direction line goes red after a move, or when price opens on the other side of the volatility channel.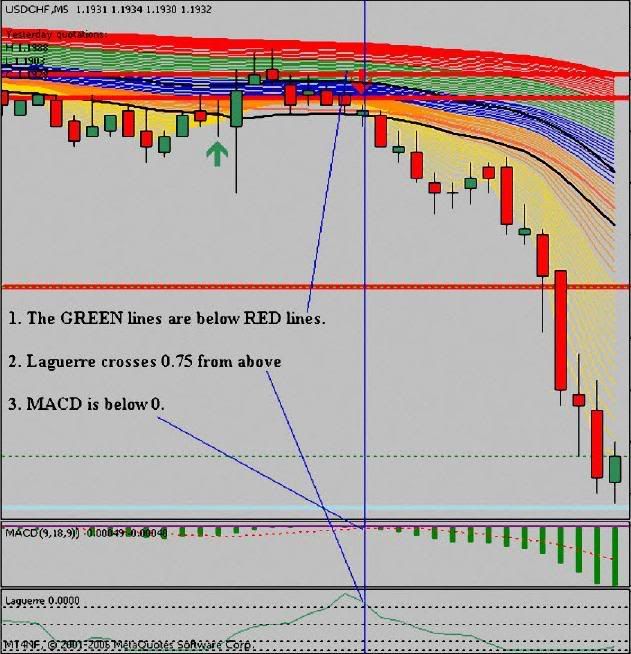
SUMMARY
That's it, I hope you enjoyed the reading and that it was presented with words easy to understand. May this method help you to be more profitable and better trader.
As the author of this system I reserve all rights for it. You may NOT share any information given here, outside this website. If you want to share this system with a friend you can direct them to this web page where they will find all the necessary information
Friday, June 6, 2008
Kongsi Indicator MT4
Ada beratus indicator dalam simpanan saya, tapi ini adalah permulaan untuk berkongsi indicator yang digunakan dan juga tidak digunakan. Perkongsian ini menggunakan perkhidmatan 4shared.com Jangan lupa ambik fail 100 langkah doc. Ini adalah strategi yang saya gunakan untuk mencapai target yang dikehendaki. Bila nak capai bergantung kepada anda sendiri. Yang penting DISLPIN sebagai seorang trader yang profesional. http://www.4shared.com/dir/7409838/14c693d8/forex4u.html


